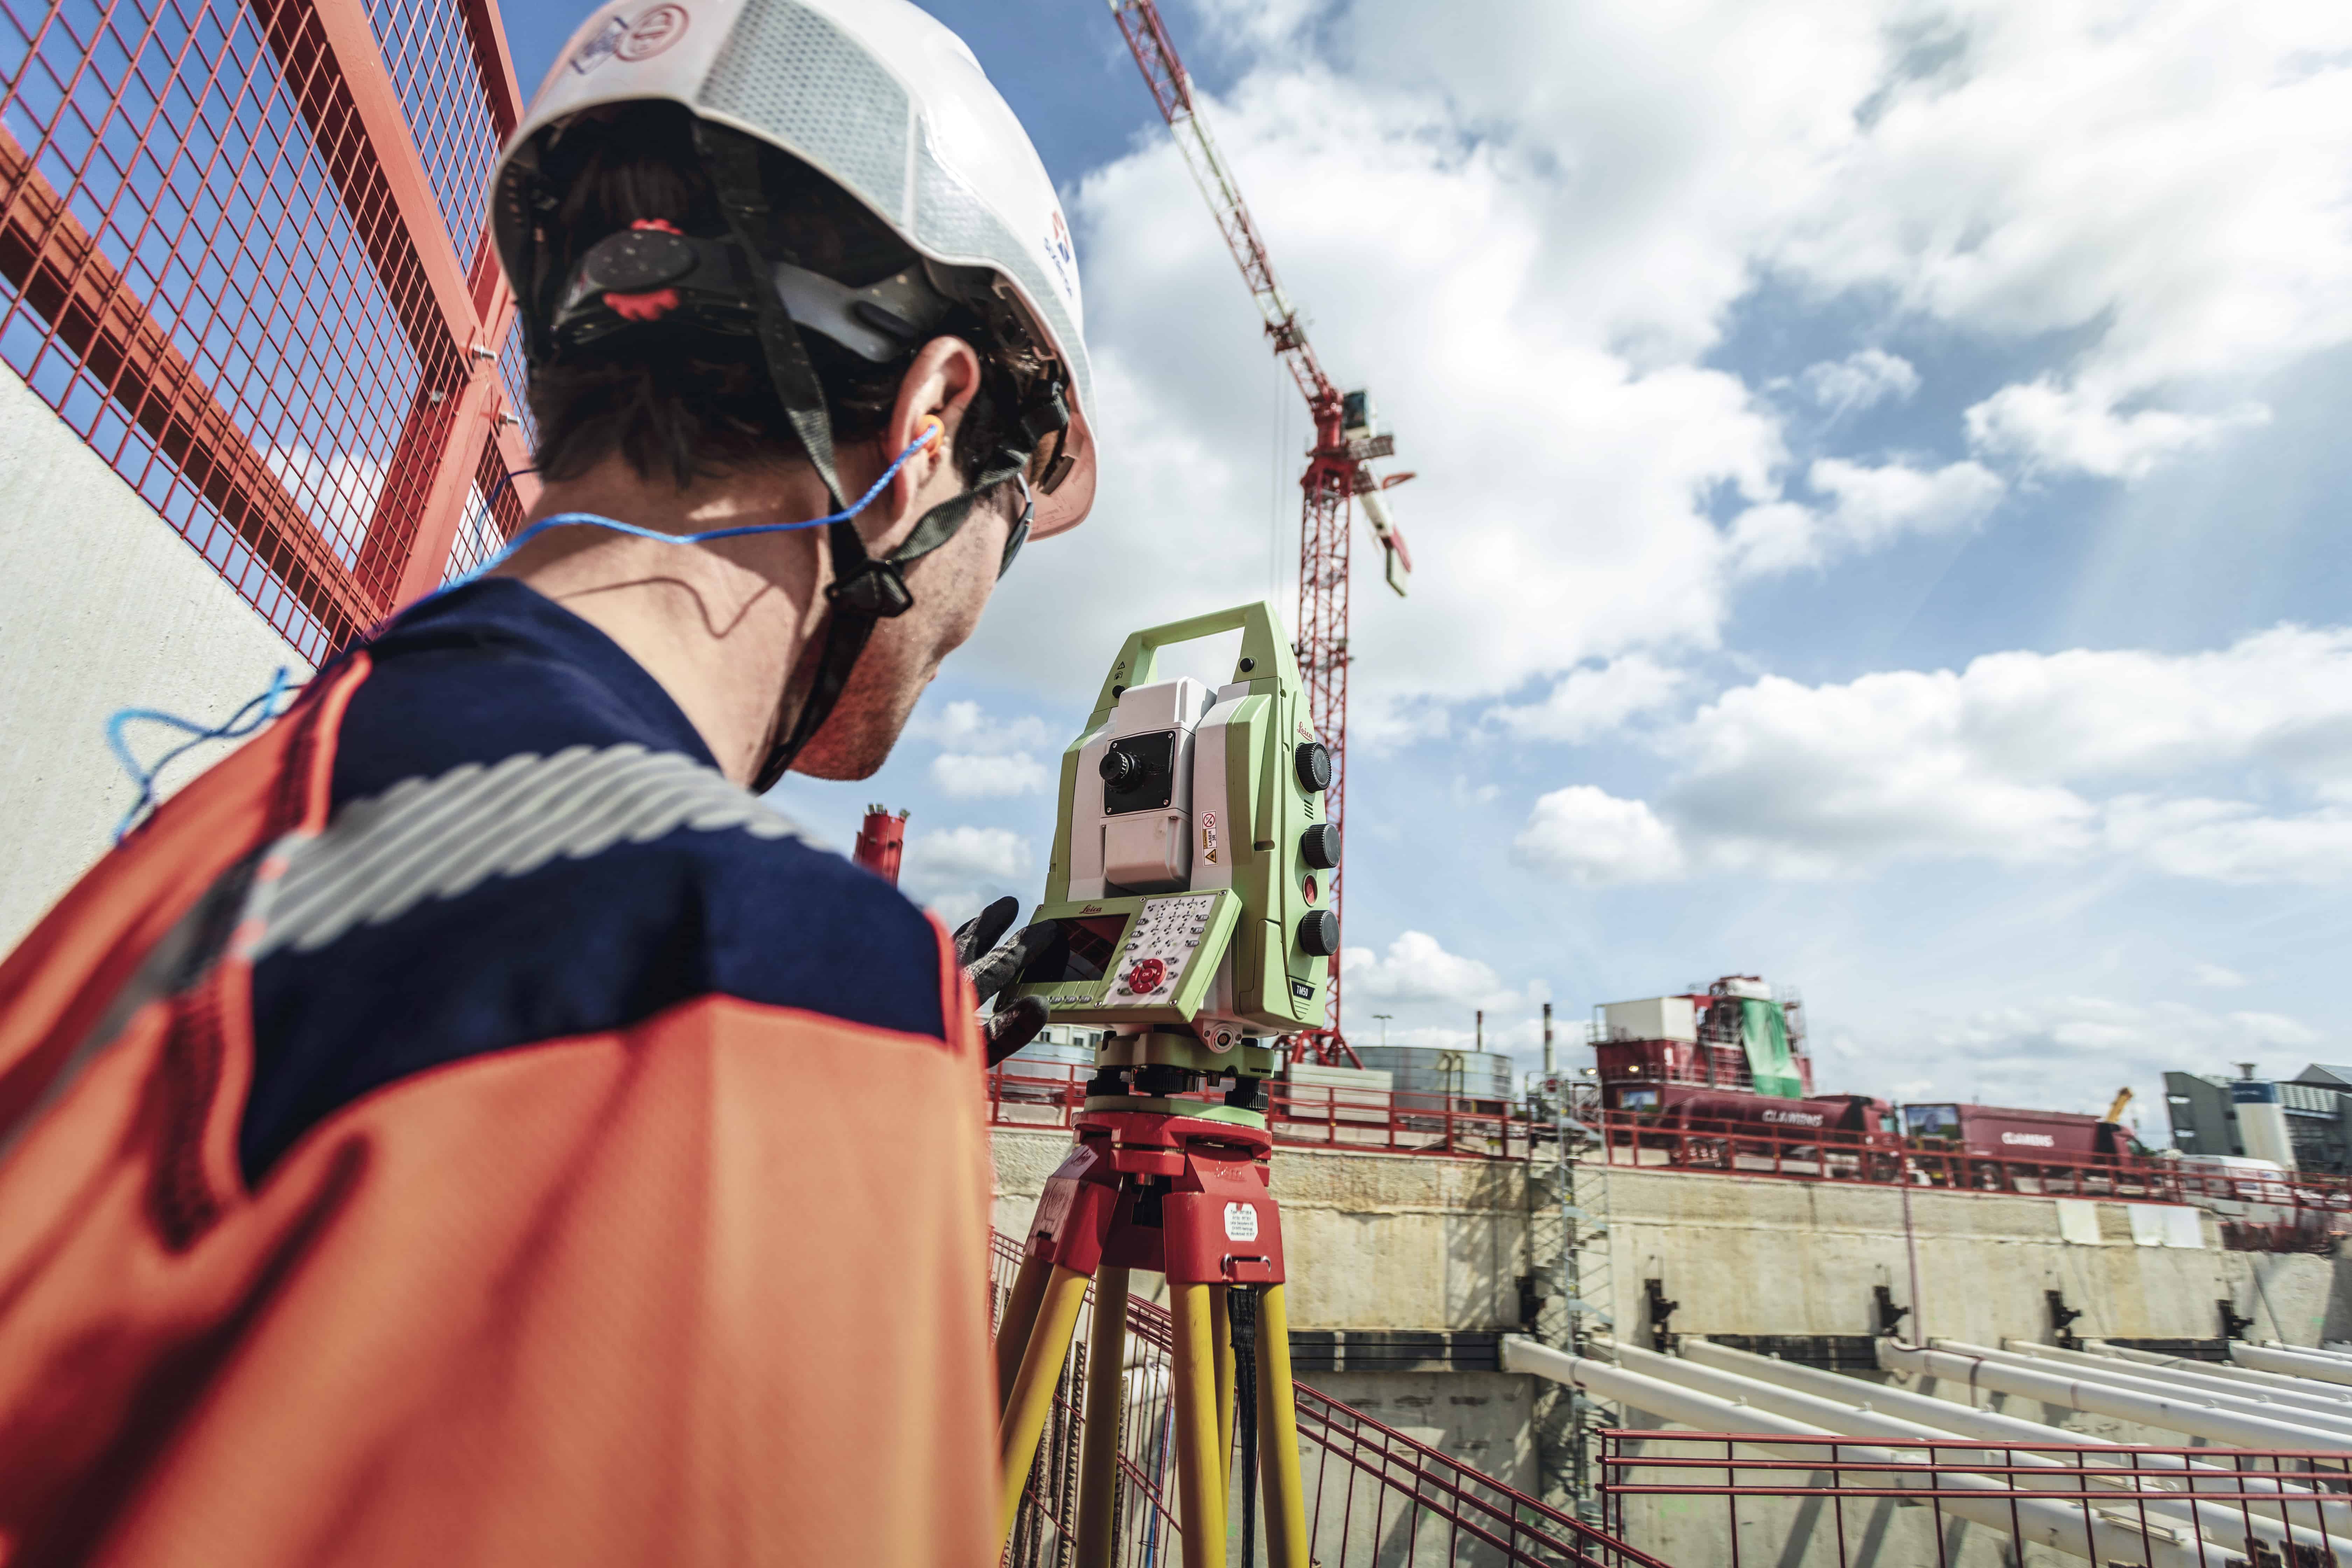
5. Mount and Position the AMTS Units
Each automated motorized total station mounts on a tower, wall bracket, or purpose-built platform positioned for unobstructed sight lines to every assigned prism. The AMTS must have a direct line of sight to all reference and monitoring prisms from its fixed position, so the mounting location needs to be finalized only after confirming visibility to every target on site. Even a single blocked sight line means a gap in the displacement record for that prism until the obstruction clears.
Stable mounting is the most important performance factor at the instrument level. Vibration from nearby construction equipment, thermal expansion of the mounting structure, or settlement/rotation of the platform all degrade the accurate coordinate output the AMTS produces. Steel towers with concrete foundations or rigid wall brackets on stable structures are the standard options. The mounting must be stiff enough that wind loads and temperature swings don’t shift the instruments between observation cycles.
Power and environmental protection complete the installation:
- AC mains: preferred option where site infrastructure allows
- Solar panels with battery backup: for remote or temporary sites that lack grid access
- Weatherproof enclosures: shield the instrument from rain, dust, and temperature extremes
With the AMTS units mounted and powered, the next step is connecting the data acquisition and communication systems that move observation data off-site.
6. Configure Data Acquisition and Communication Systems
The on-site controller is the central hub of the data acquisition system, scheduling measurement cycles, directing AMTS observations, and transmitting recorded data to the processing server. Communication links use cellular modems, Wi-Fi bridges, or hardwired Ethernet connections depending on site infrastructure and access requirements. The controller manages the full observation sequence: target acquisition, angular and distance measurement, data collection, and transmission, running the process automatically without manual intervention.
The data flow follows a clear path:
- AMTS captures angular and distance measurements
- Controller logs data locally and transmits to the processing server
- Cloud software runs quality control checks, least-squares adjustments, and flags outliers
- Web platform publishes displacement trends, time-serlive plan views, alert functionality, automated reports, and project journal
Project teams work with all monitoring information through an AMTS monitoring data platform that consolidates data collection, processing, and alerts into a single web interface.
Measurement frequency is one of the most important configuration decisions:
-
- Active excavation: hourly observation cycles to capture rapid ground movement
- Long-term structural/dam monitoring: 4-6 hour intervals, reducing data volume while detecting gradual trends The team can configure observation frequency remotely at any time using the platform’s management console, tightening or relaxing the cycle as construction phases change and performance thresholds shift.
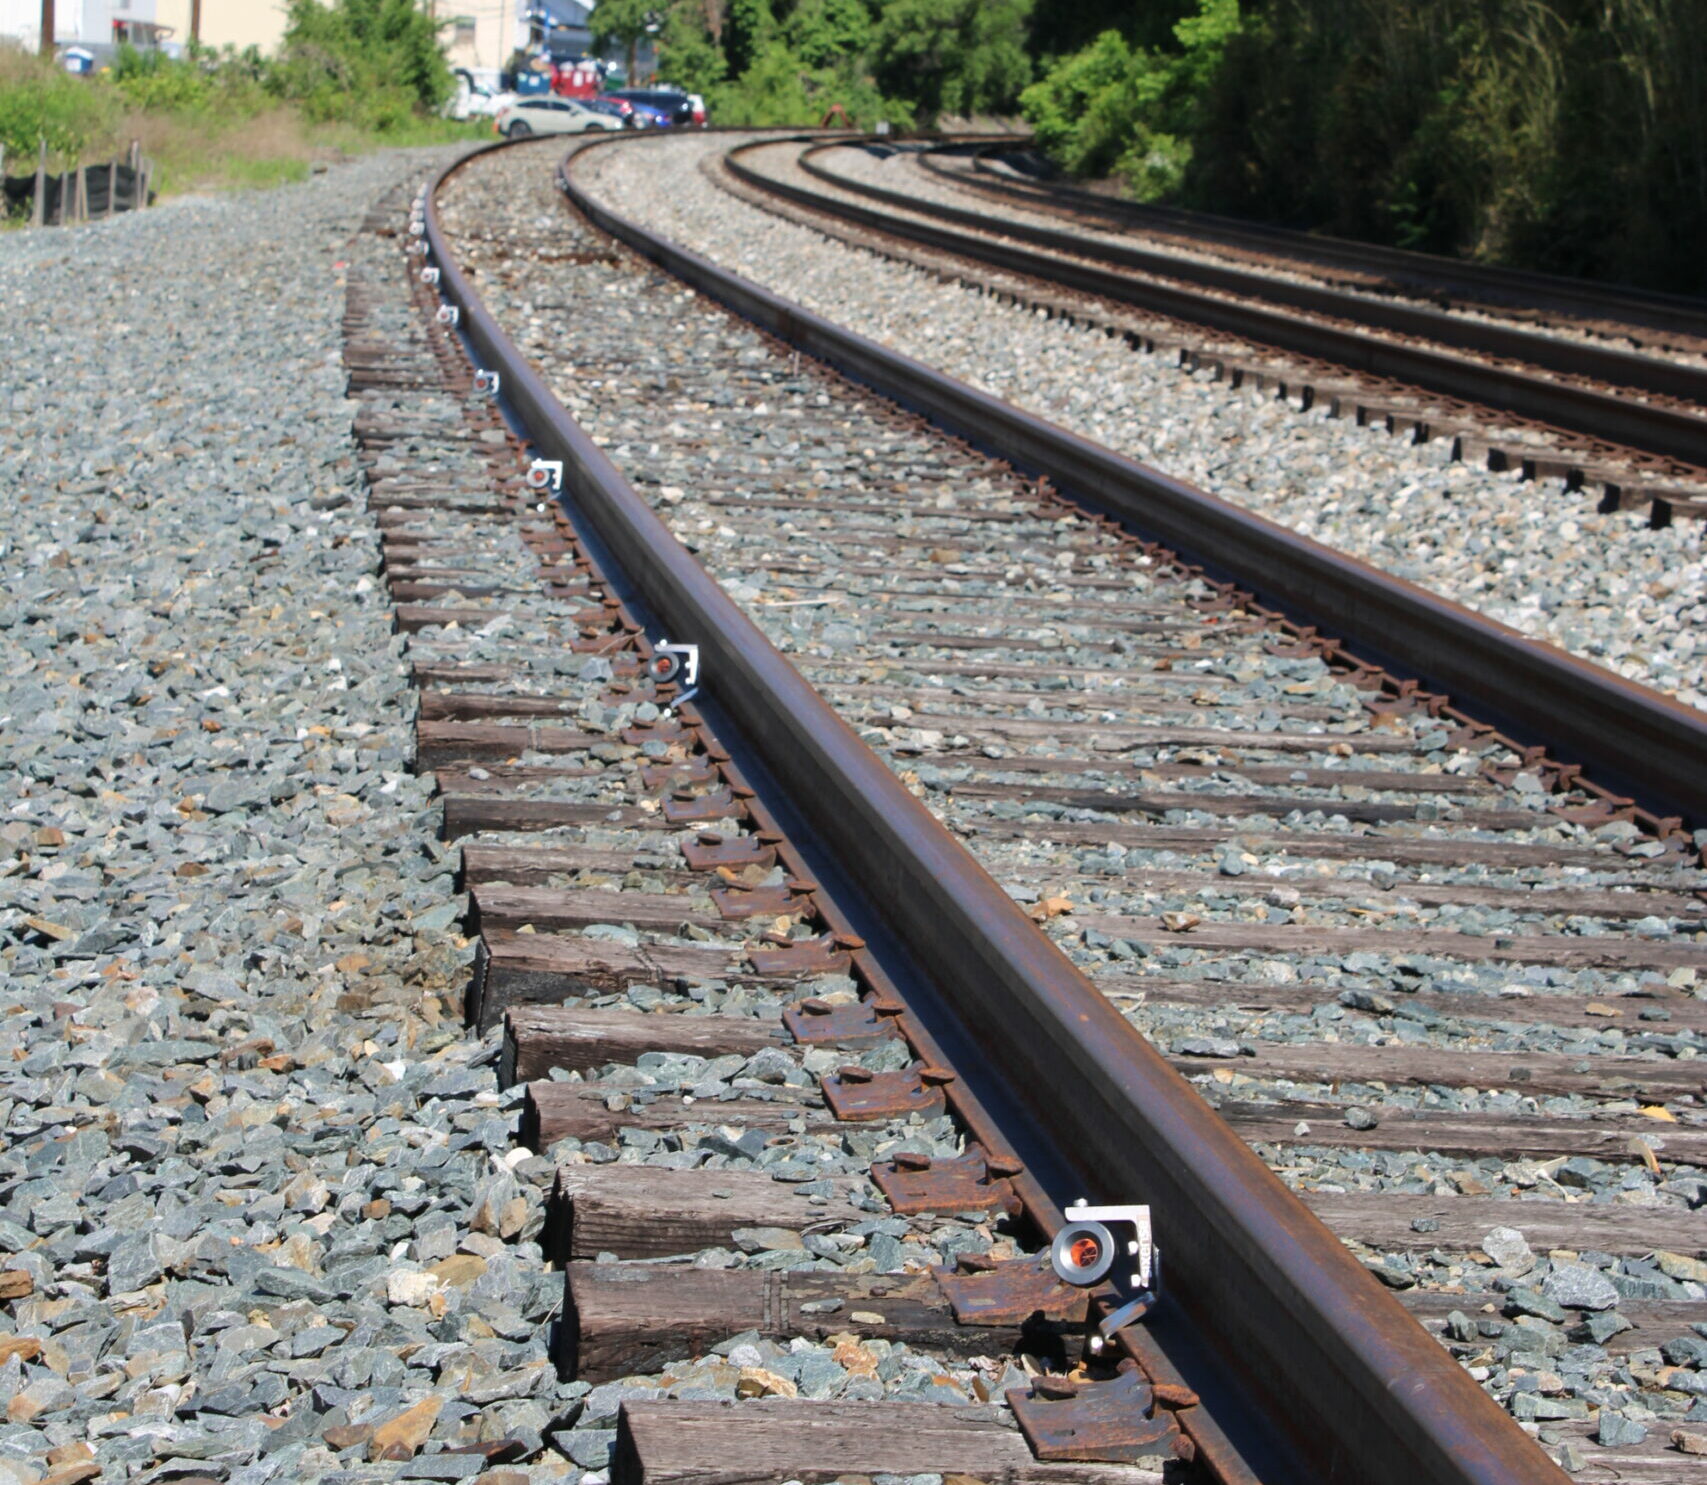
- Rail monitoring: Hourly observation intervals to capture quick changes in track geometry
With data flowing from the field to the processing platform, the final step is calibrating the network and activating continuous monitoring.
7. Calibrate, Validate, and Activate Continuous AMTS Monitoring
Before activating continuous monitoring, run a week or two week long baseline measurement period to establish reference coordinates and validate the network’s repeatability. Compare results from consecutive cycles against each other and against known control points from independent survey data. If the coordinate differences between cycles fall within the project’s precision thresholds, the network is producing accurate, stable output. If they don’t, revisit prism alignment, reference geometry, or atmospheric correction settings before proceeding.
Once the baseline is validated, set alert thresholds aligned with the project’s trigger levels. The monitoring platform flags any measurement that exceeds a threshold, sending immediate, automated notifications to the project team via email and text message. This process runs continuously: the AMTS cycles through its prism list on the configured schedule, the server applies least-squares adjustments and quality checks to each data set, and the web dashboard updates displacement time-series graphs in near real-time.
Ongoing performance depends on regular maintenance:
- Periodic prism cleaning
- Instrument servicing
- Reference coordinate verification
The network operates unattended between maintenance visits, but the automated alert system catches anomalies the moment they appear in the data, so the team can intervene before data gaps start to appear in the monitoring record.
The reliability of this entire workflow depends on the hardware and software components that make up the AMTS monitoring network and the quality of the installation.
What Are the Components of an AMTS Monitoring Network?
A complete AMTS monitoring network relies on 4 main components that work together to deliver continuous, automated displacement data.
| Component |
Function |
Setup step |
| Survey prisms |
Passive optical targets (reference + monitoring) |
Steps 3-4 |
| AMTS instruments |
Robotic total stations for automated measurement |
Step 5 |
| Controllers + comms |
Schedule observations, transmit data |
Step 6 |
| Processing software |
Least-squares adjustments, alerts, dashboards |
Steps 6-7 |
This section provides a component-level breakdown for teams that need a clear grasp of the equipment before starting the setup or evaluating a monitoring proposal. The tools and management systems described below correspond directly to the 7 installation steps covered above.